The Grating Challenge
This page contains hints, solutions, and advanced challenges for our diffraction grating challenge. If you would like a grating (or a set for your class if you are a teacher), please contact us at [email protected] with a request and we will get that sent to you asap.
Our challenge to you: Find a way to measure the spacing between the grooves in this grating. Note that the challenge printed on the back of the slides suggests that you use an LED. A white light also works very well, and is the path shown in the hints below.
The larger idea is that once you know the groove spacing or, equivalently, the number of grooves per centimeter or inch, you could use this grating as a simple spectrometer to make detailed studies of spectra of light from different sources. For example, many satellite observatories (James Webb, Hubble, Kepler, TESS, Pandora, Ariel) have sensitive spectrometers that can measure very faint variations in light spectra due to molecules in the atmospheres of extra-solar planets (that is, planets around far-away stars), which can help us determine whether these planets can possibly sustain life!
Hints
What is a grating, actually?
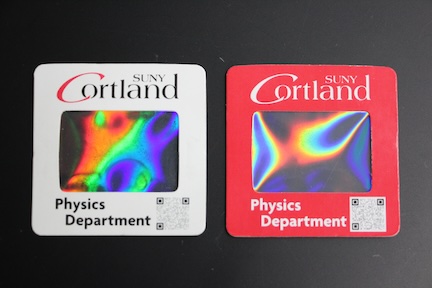
A grating (or more properly, a diffraction grating) is an object with a patterned surface that causes light to diffract. For visible light, these structures are microscopic, but tall buildings in a city can act like a diffraction grating for radio waves. Gratings can be made by creating variations in the thickness of an object (physically etching a surface), by creating variations in the material composition or density, or by creating variations in the opacity (transmission or tint) of a surface. Your grating has a surface that is textured with small grooves that change the thickness ever so slightly.
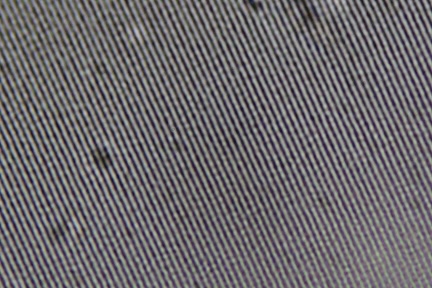
The image at the left is the surface of one of our gratings under 80x magnification, taken by Physics Department Lab Technician, Zach Eridani. The image shows many microscopic grooves. The variations in thickness of the surface introduce a spatial modulation of the phase of the wave, which results in a bending of the wavefront (the direction of propagation) of light, where the magnitude of the effect depends on wavelength.
How do I use a grating?
The obvious way to use the grating is look through the grating at a light source. If you look at a white light, you will see a rainbow pattern to the sides of the light source.
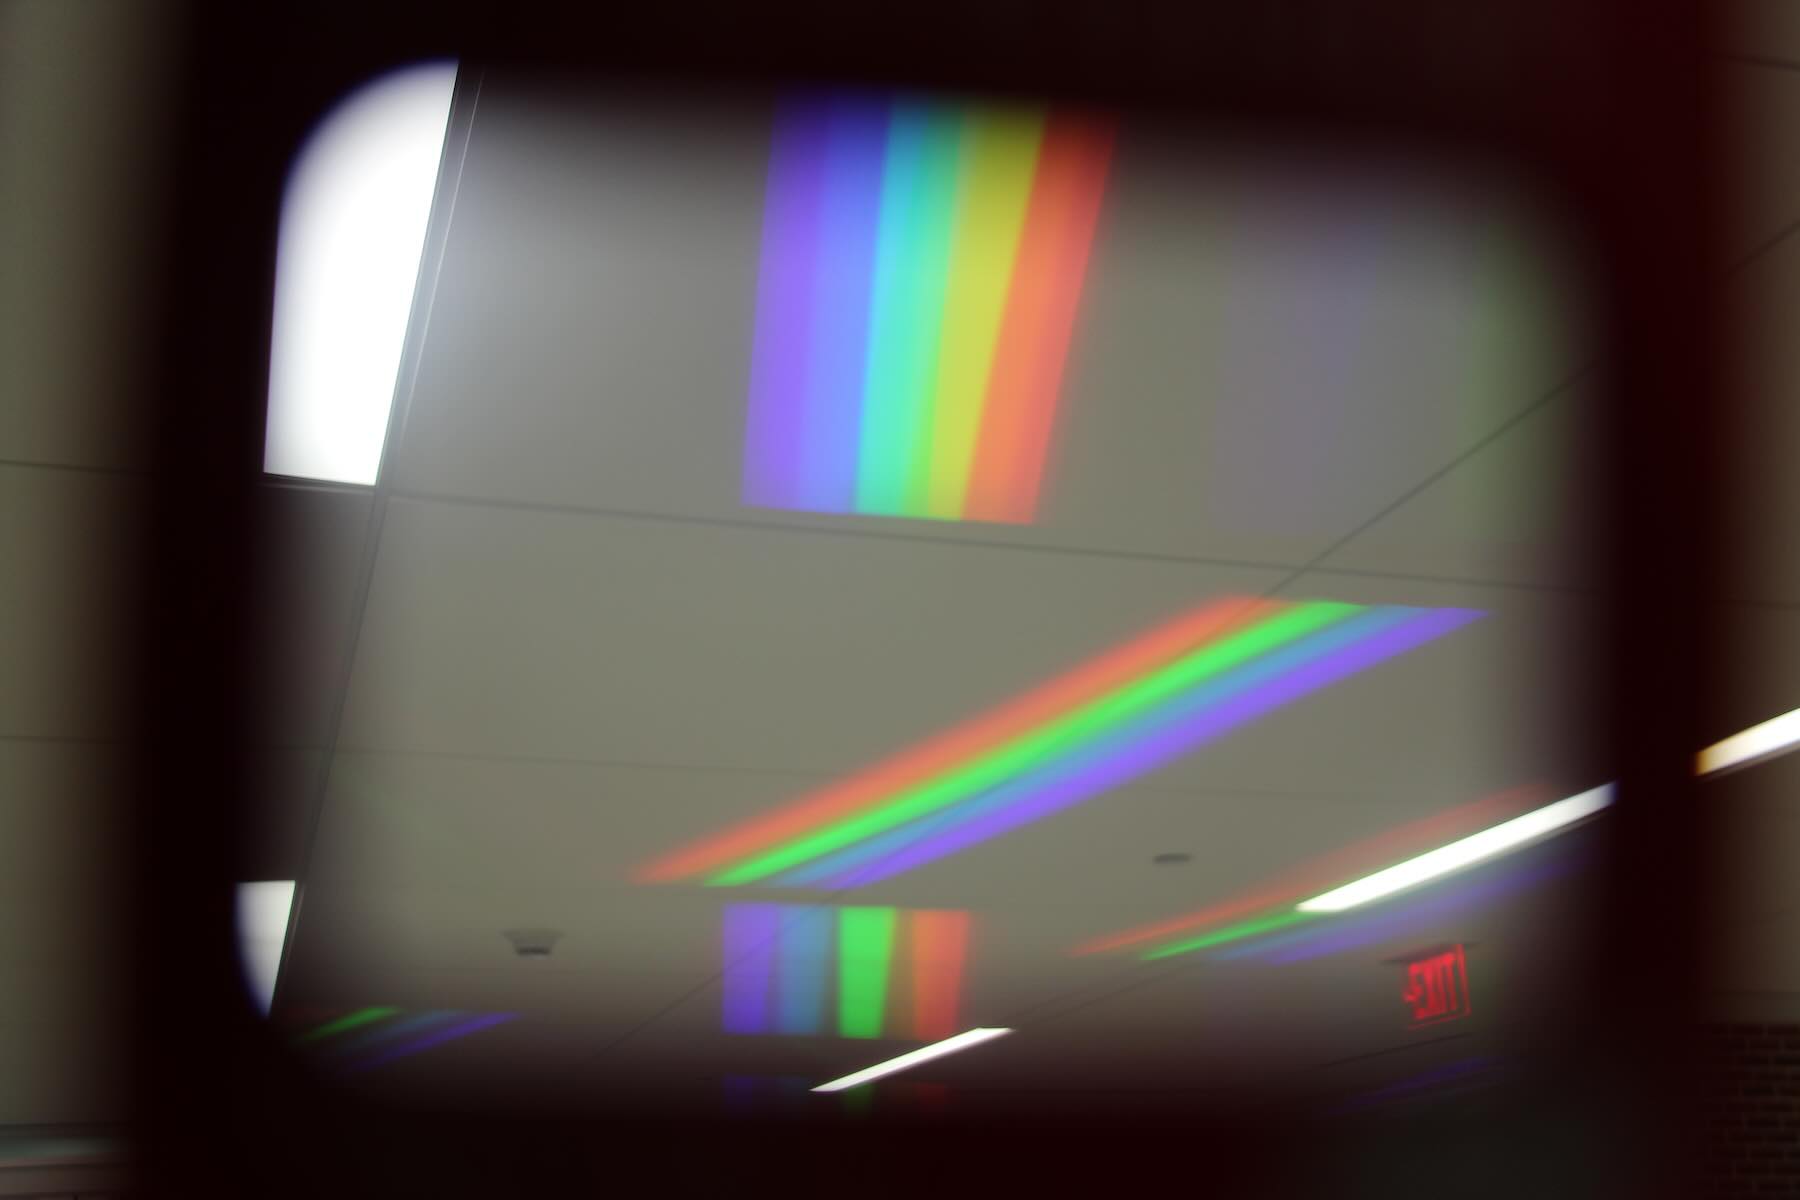
The fluorescent lights in Bowers hall show clear rainbow patterns, with surprisingly sharp lines between the colors (why is this?).
 An EXIT sign (in the bottom right in the image above) when viewed from below creates a line source of red light. The diffraction pattern also only shows red light.
Where do I start?
A good place to start with a new puzzle is to play around with it and learn a thing or two. You can start by looking at a light source (not the sun and nothing very bright) through the grating and changing the setup to infer how it behaves.
Questions to get you started
- Is the pattern of colors repeatable? That is, does red always appear in the same location relative to blue (for example), independent of which kind of light you look at, or is it more complicated than this?
- How does the pattern vary as the grating is moved closer to or further from the light source?
- How does the pattern vary the grating is moved closer to or further from your eye?
- What happens to the pattern as you tilt the grating relative to the plane of your face?
- Is there a proper orientation to the grating? That is, what happens when the grating is rotated? What happens when the grating is flipped over and you look through the back of the slide?
The grating equation
d sin(θ) = λ,
where d is the spacing between the grating lines, θ is the angle at which the light bends (measured relative to the straight-forward direction), and λ is the wavelength of light. If you are familiar with this equation, you may notice that the right-hand side of this equation is often written as n λ, where n is a positive or negative integer (including zero). While that is entirely correct, we are going to limit this analysis to the case where n=1, which is referred to as the first-order diffraction band. If you put the grating close to your eye you should be able to see another band further to the side that is fainter - this is the second order or n=2 band, but it is not useful for the purposes of this challenge.
The not-so-obvious way to use the grating
While holding the grating in front of your eye is a good demonstration of the effect of the grating, it does not work particularly well for measuring an angle. If passing light through the grating toward our eyes is not the path to the solution, it must be that the path to a solution requires that we turn the system around and let the light head away from our eyes.
Measurement setup
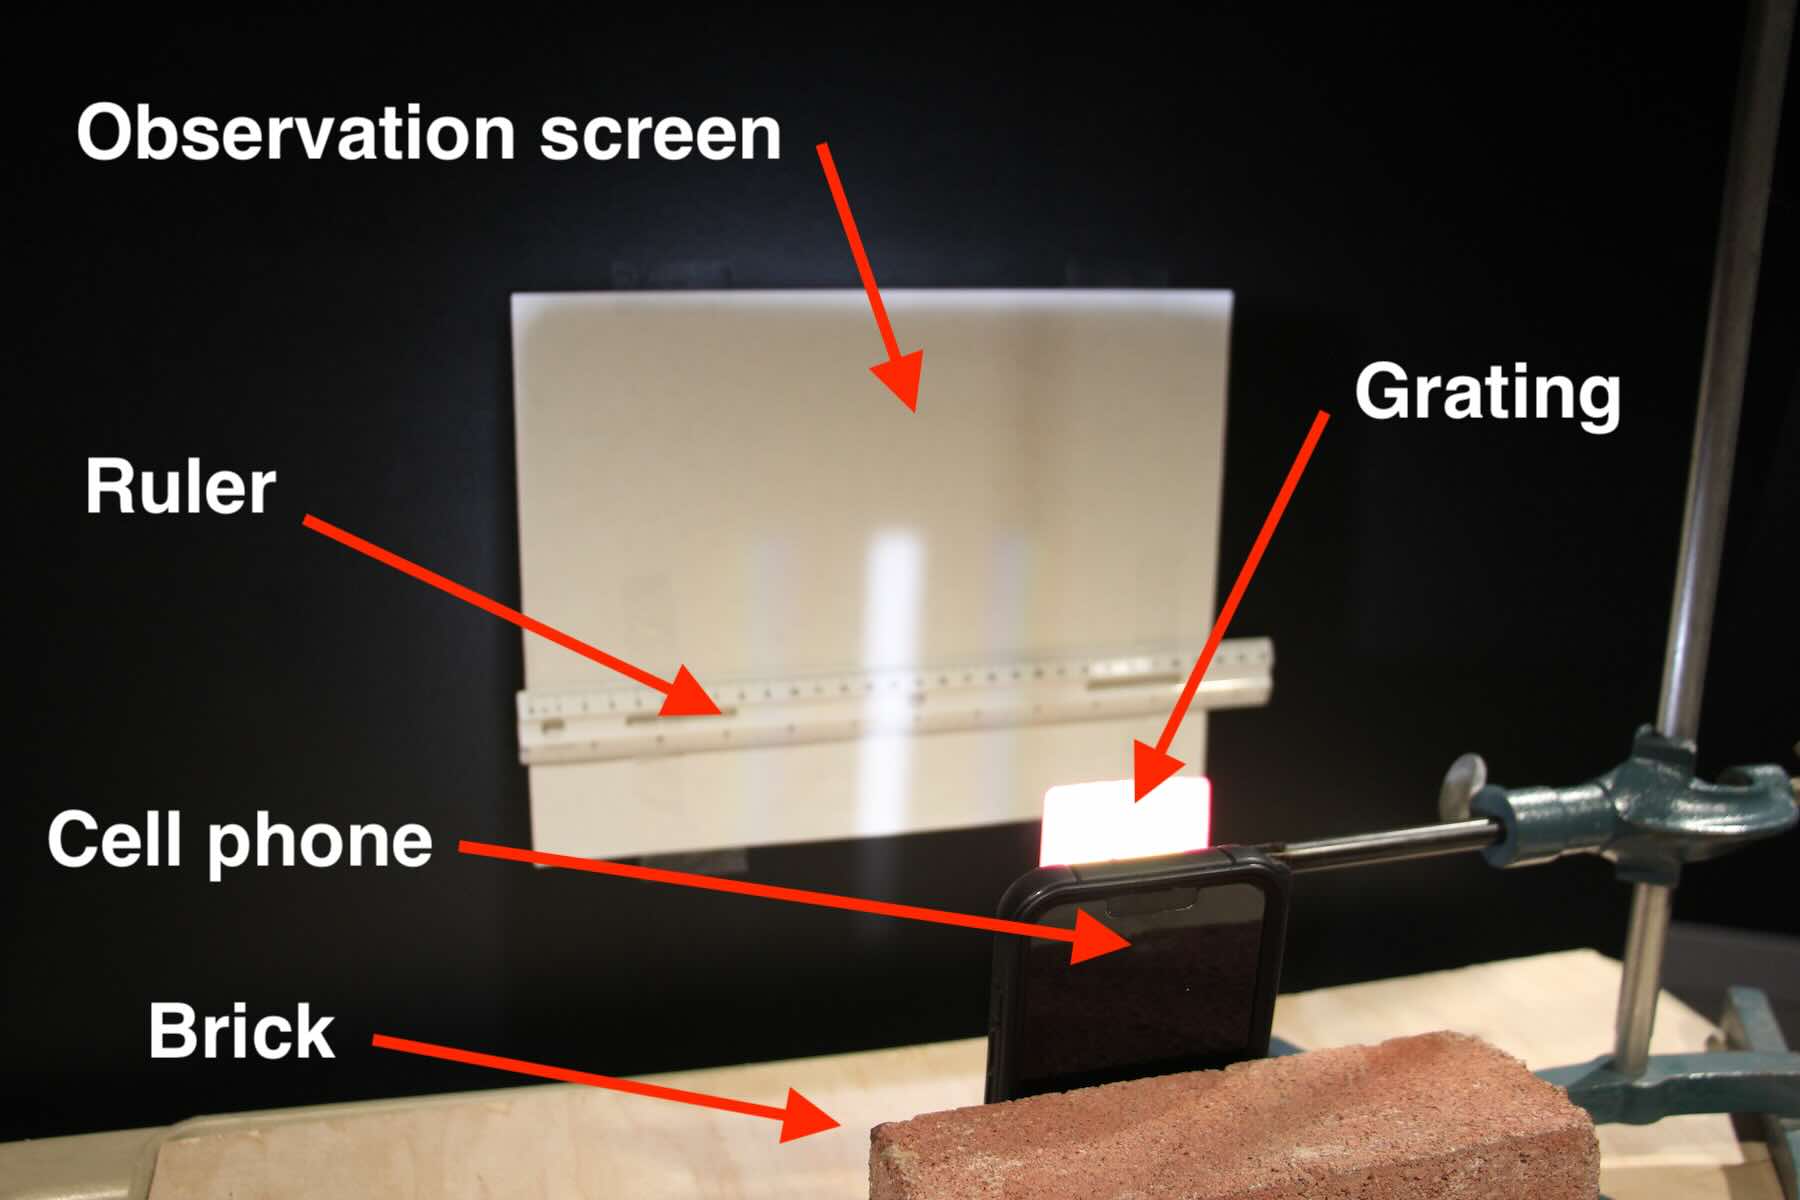
The bands you will be looking for are fairly faint, so you will likely want to set this up in a dark space. We used the SUNY Cortland planetarium for this project since it is easier to get good photos in a large space like this. Our light source is the flashlight on a cellphone, which is leaning against a brick (at the bottom of the picture shown here). Light passes from the source through the grating (the white card mounted on the arm that is connected to the stand) and onto an observation screen, which was placed 20 cm from the grating. We taped a ruler across the image so that we could directly measure the band positions from the photos, but you can just mark the color bands with a pencil on a paper and measure afterward.
That's great, but I don't have a planetarium at home.
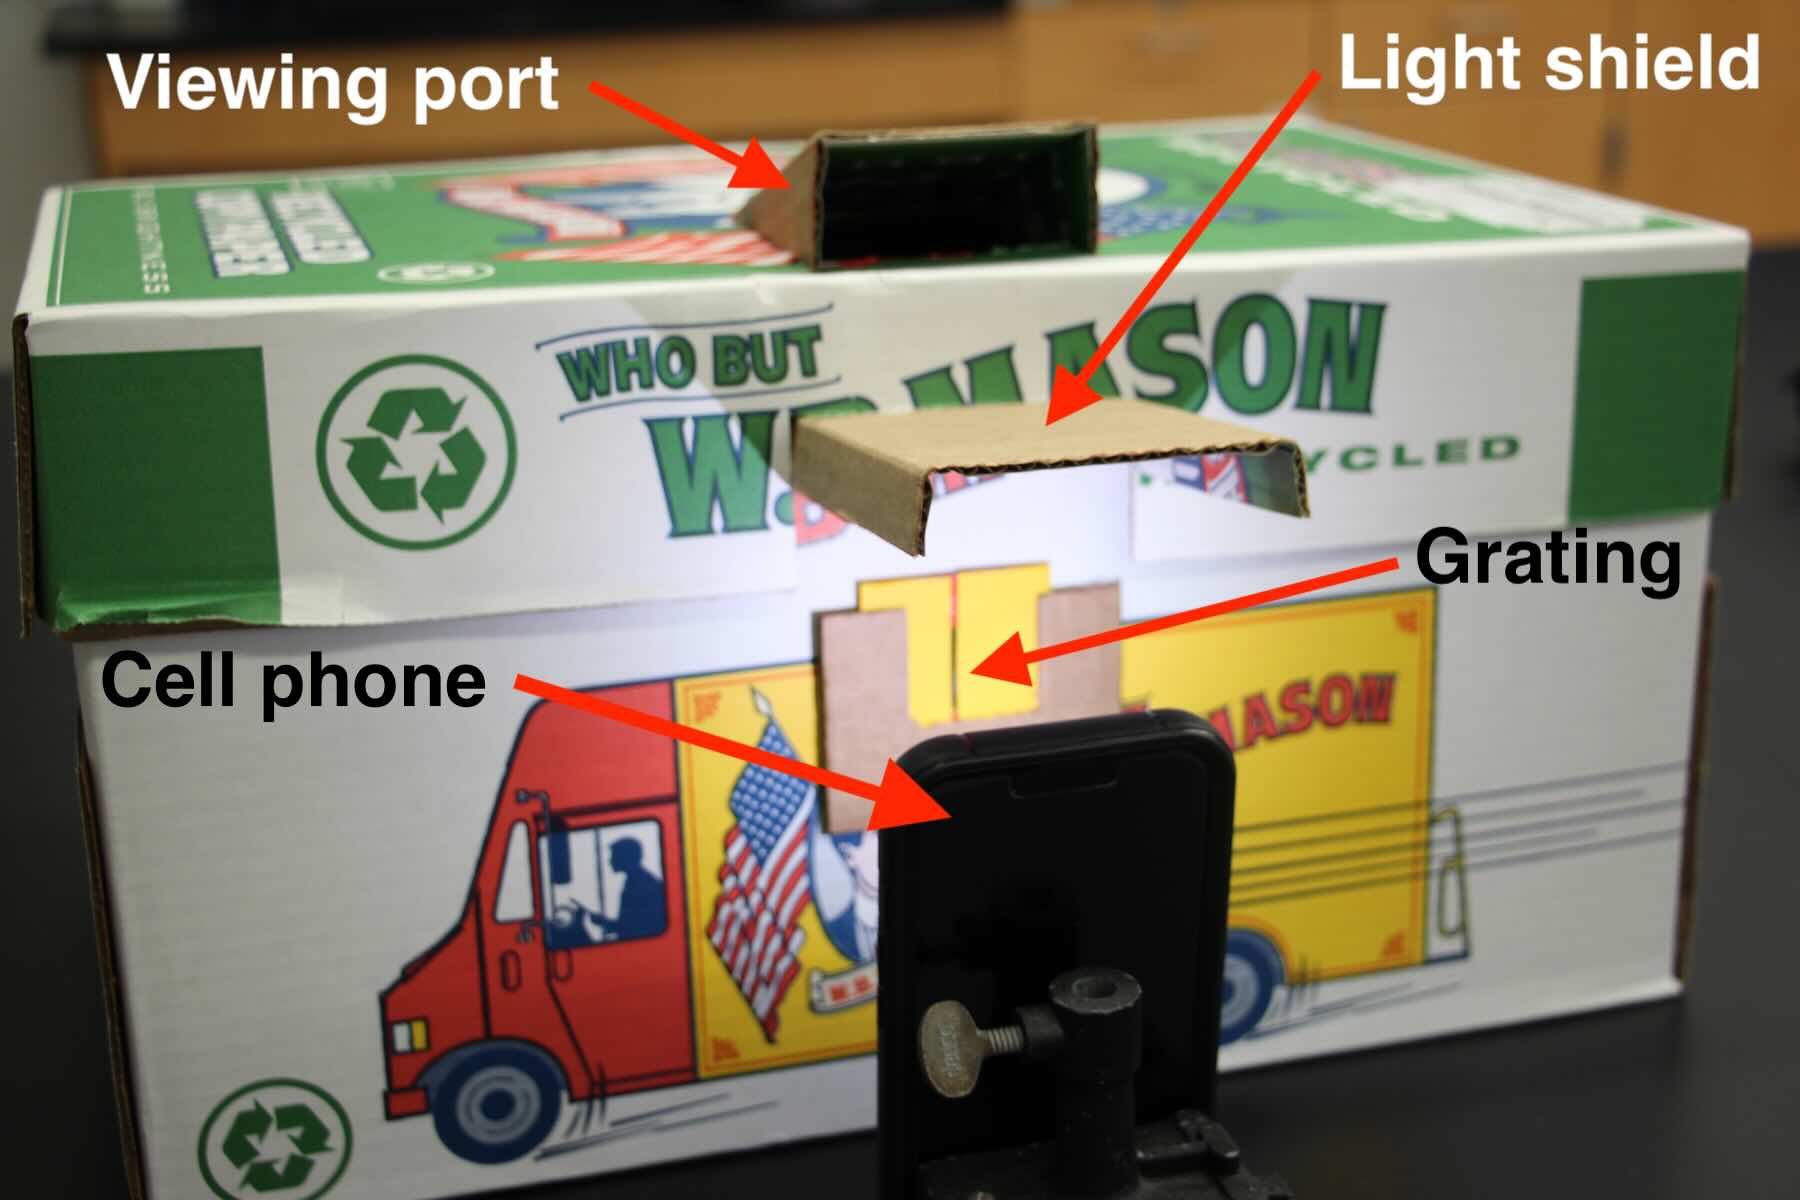
You can make a simple and effective DIY spectrometer with a cardboard box. Note that the colors you will be looking for are really faint, so you will need to make your spectrometer fairly light-proof. In this setup, the viewer looks in toward the observation screen (the back of the box) from the angled viewing port on the top. We added a light shield between the viewing port and the light source to block stray light from the source, which can be significant enough to cause one's eye to become less sensitive to the dark and therefore harder to see the faint diffraction patterns that we are looking for.
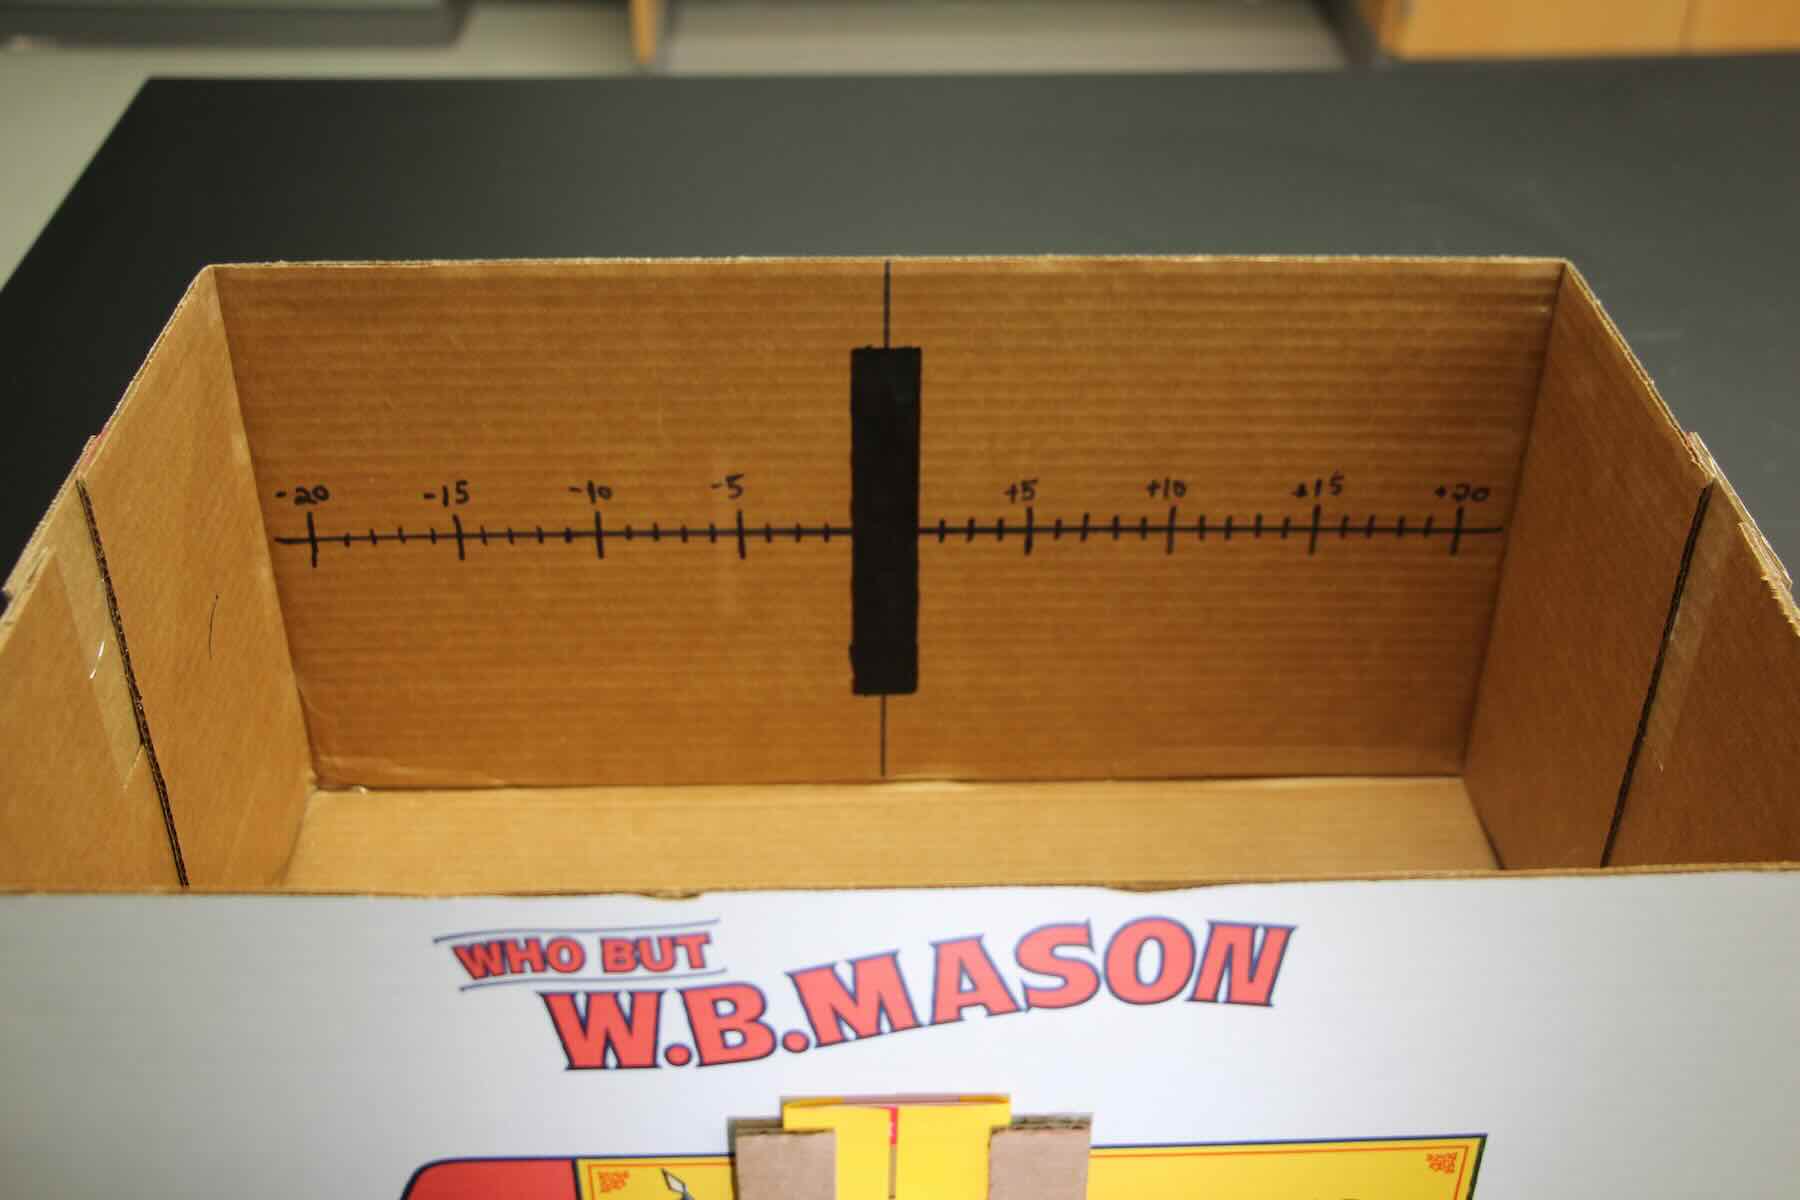
Inside the spectrometer we drew a central line and a measurement axis labeled with centimeter increments. The black rectangle in the middle is there to try to absorb some of the white light of the central beam, which can reflect off of the back of the box and cause a significant amount of light pollution in the interior, making it harder to see the faint diffraction pattern. Maybe you can devise a better way to manage this unwanted light.
Help! I only see only white light on my observation screen.
You are seeing a broad white pattern because the wide area of the grating is admitting too much light and your diffraction pattern is getting washed out by the broad background light. To make this work you have to limit the region through which light passes.
How do I limit the amount of light through the grating?
An object that limits the amount or extent of light entering an optical system is called an aperture. You can create an simple and effective linear aperture by attaching two sticky notes to the grating. Note that the direction of the aperture matters. It might be interesting to see what happens with the aperture oriented perpendicular to that shown here.
Measuring the angle
To determine the angle from the grating to the observation point you will need to make some measurements. A good way to do this is to make some marks on a paper and then measure the positions afterward. If you aren't sure how to do this, take a look at our setup under the previous hint and consider doing something similar.
I can measure position, but how do I get an angle?
For this, we will need to use some trigonometry. Or a protractor if you have one, but getting a good estimate of the angle might not be so easy given that your protractor is on one plane and the observation screen is on another plane.
To do this using trig, we also need to know the distance from the grating to the observation screen. Calling the position of a particular color x and the distance from the grating to the screen L, we have tan(θ) = x/L. You can now solve this equation for θ by using the inverse tangent function (arctan). Alternatively, since we know that we need sin(θ), we can use the Pythagorean theorem to get the hypotenuse of the triangle, which allows us to develop an equation for sin(θ).
Click here for the trigonometry
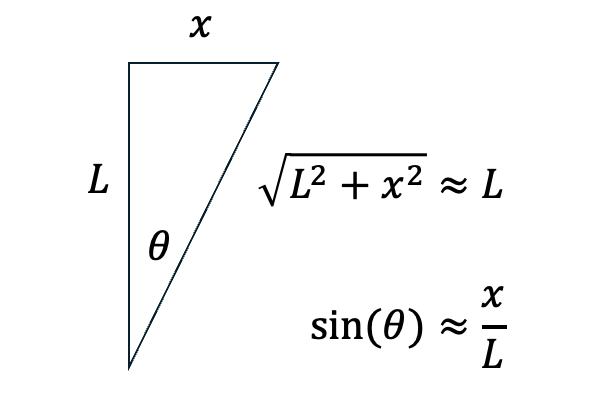
For small angles, we can use the approximation that sin(θ) ≈ x/L. Of course, this is not perfect, but the error from this approximation is likely quite a bit less than the uncertainty from our experimental setup, so it doesn't make sense to worry about it.
What values do I use for the wavelengths?
Unless you have a calibrated light source, this part takes a little guesswork or some further research. Very roughly, the visible spectrum spans 400 nm (violet) to 750 nm (red). Below that is the UV spectrum and above that is the IR spectrum. To start, you can mark off the boundaries of your spectrum. If you don't see violet, but see something more of a blue color, then you may want to adjust the short wavelength limit to be about 475 nm (blue is considered to be in the range of about 450-500 nm). The greens are roughly in the range of 500 to 570 nm. If you have normal vision (not color blind), then you can mark off the green region as well and use that for additional data points.
Further research
The flashlight on your cellphone likely uses a single white LED that produces a continuous spectrum of light of different color. Using this light means that we have to make some educated guesses about the wavelengths we see. While decent, they are nonetheless guesses.
![]()
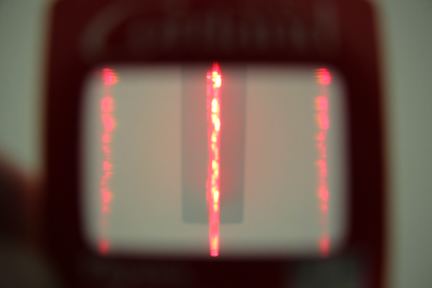
Alternatively, if you were to use the light from a white image on the screen of your cellphone, you would see that the diffraction pattern has three distinct color bands in the red, green, and blue. This is because color on our screens is produced by a combination of red, green, and blue pixels. When these pixels are small enough, they blend together to create what appears to us to be a uniform color.
Image credit: The Exploratorium
You could do some research on the wavelengths of these LEDs (they are pretty standard) and try to use the light from a white screen to make more precise measurements.
Solutions
Analyzing the data
The simplest place to start is to calculate d for each color using the angle and wavelength data. There are more sophisticated ways to do this kind of analysis that attempt to eliminate systematic errors (bias), and one could include additional data points, but this is good enough for a start.
Solving the grating equation for the groove spacing gives d = λ / sin(θ). Recalling that sin(θ) ≈ x / L for small angles, an approximate solution combining all measured terms is d ≈ λ L / x.
Sample calculation
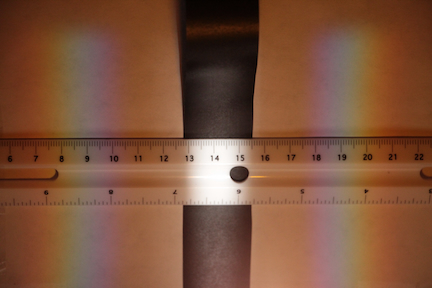
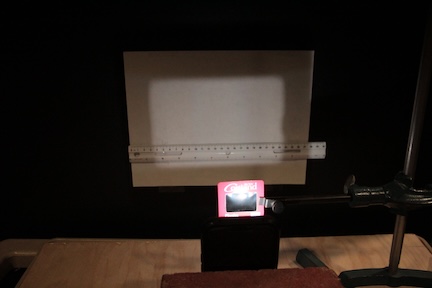
The picture of our setup, using the grating with a linear aperture, shows nice bands of color to either side of the white part in the middle. We added a black strip of paper down the center so that the photo did not saturate due to the bright light reflected from this region, but you won't need to do that. The center of the diffraction pattern is close to the 14 cm mark. We see that the nearest edge of the violet band is about 4.0 cm from the center and the far edge of the red band is about 7.5 cm from the center. The grating was placed 20 cm from the observation plane.
violet light: d ≈ (400 nm)(20 cm)/(4.0 cm) ≈ 2.0 μm
red light: d ≈ (750 nm)(20 cm)/(7.5 cm) ≈ 2.0 μm
Alternatively, had we used the exact formula for sin(θ) we would have calculated 2.0 μm and 2.1 μm, respectively. Note that μm is a micrometer, which is equal to 1 /1000th of a mm. Expressed as a number of lines per unit length, 2.0 μm between lines is equivalent to 500 lines/mm, 5000 lines/cm, or 1970 lines/inch.
What is the actual answer?
According to the manufacturer, these gratings have 500 lines per mm, equivalent to 2.0 μm between lines.
The moral of the story
Hopefully you learned something new as you worked on this project. This kind of thing is representative of what we aim to teach you in the Physics program at SUNY Cortland. There are a few important "morals" to this story:
- Seemingly simple things get deep very quickly, especially if one has ambition to do something precise and quantitative. This is why scientists and engineers get paid good money to do what they do.
- Success in a project like this requires a combination of
- Theoretical understanding that allows us to see the relationships between different things and allows us to simplify complicated models, and
- Physical intuition that allows us to do real things in the real world.
- Don't expect your first go at something to lead you to instant success. Physics is best approached as an iterative process. Patience and perseverance are the real keys to success, in physics and life more generally.
There is more you can do
There are many more things you can explore with this grating as you develop your setup and make it into a functioning spectrometer for scientific studies. You might consider the following questions as starting points for further development.
- What is the optimal aperture width?
- How, specifically, does the width of the aperture affect the diffraction pattern?
- Does the distance from the light source to the grating affect the diffraction pattern? If so, how?
- What happens if the grating is tilted at an angle with respect the direction of light from the source?
- Does the polarization of light matter? That is, if you combine the grating with a polarizing filter, does this affect the result? (You will need a polarizing filter to test this.)
- Is it possible and advantageous to combine lenses with the grating to improve the light gathering capability of this system? If so, what specific optics should be used and how does one design such a system?
Advanced Challenges
Strange patterns
If you view an extended object (that is, something with some significant depth to it) through the grating, you may notice that something strange happens with the patterns. This puzzle asks you to imagine what you would see if you looked at this light bulb through the grating.
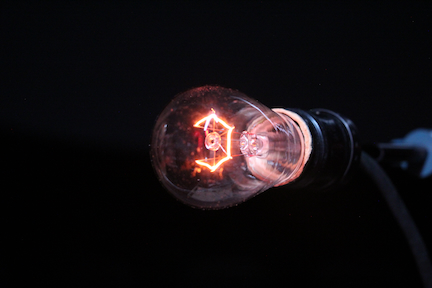
This light bulb has a filament in the shape of a hexagon (or, more specifically, 5 sides of a hexagon).
Bulb viewed on end through the grating
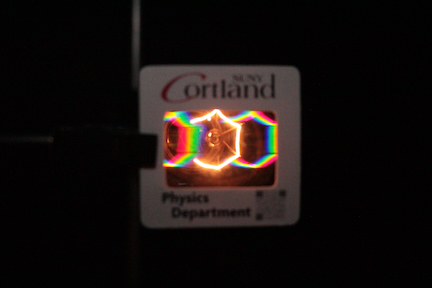
The diffraction pattern of the filament shows the same structure as the filament when viewed from the end.
Bulb viewed on side through the grating
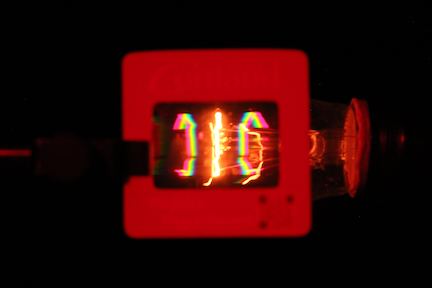
The bulb viewed from the side has all legs of the filament aligned, or nearly aligned, which appears to us as a vertical line in the center of this image. Notice, however, that the diffraction pattern of the filament viewed from this angle looks more like a "C" than a vertical line.
Why the difference?
The pattern generated by the diffraction grating is a type of hologram. That is, it preserves something of the 3D structure of the object being imaged. In the case of the filament viewed from the end of the bulb, the entire filament is at the same distance away from the grating, so the pattern produced essentially just replicates what we see. However, for the filament viewed from the side, the filament is an extended object that exists at different distances from the grating. This means that light from the different parts of the filaments enters the grating at different angle and therefore produces different diffraction pattern, which reveals to us the hidden structure of the filament that we cannot see by directly looking at it.
Seeing temperature
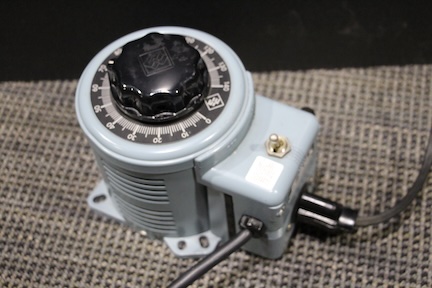
We can adjust the brightness of the bulb by adjusting the voltage across it. We can modify the 120 V AC power from the wall outlet using a device called a variac, otherwise known as a transformer. This device is essentially two interconnected inductors, which is just two loops of wire that transfer energy between each other via the magnetic field (you can learn about this in our PHY 202 course).
To take photos of the diffraction patterns under low light conditions, it helps to block the direct light from the filament by putting a strip of paper across the middle of the grating.
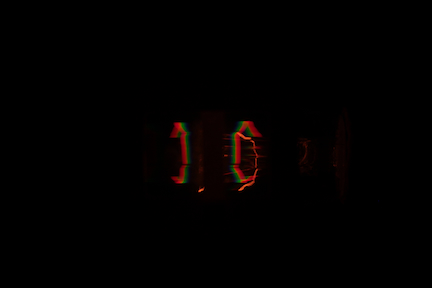
The variac was set to 50 Volts, and the exposure time for this photo was 1/250 of a second.
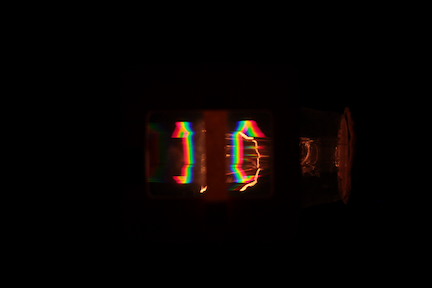
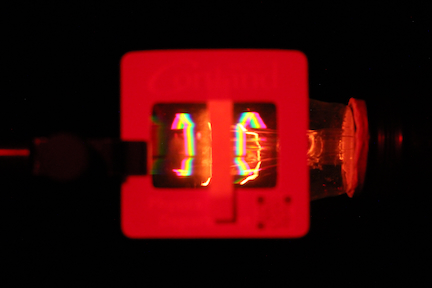
The variac was set to 100 Volts, and the exposure time for this photo was 1/1000 of a second.
What happens as the voltage is increased?
Our intuition correctly tells us that the filament will glow brighter as we increase the voltage across it. This is rather subtle, as it is not really the voltage that determines the brightness, at least not fundamentally (though it is our easiest control knob to see a variation, practically speaking). The real story here is that as the voltage is increased the current that flows through the filament increases, and with more current comes more heating of the filament (higher temperatures). The resistance of the wire is better thought of as a function of temperature, which increases with temperature, which happens to occur as voltage is increased, though the increased voltage is not the direct cause of the resistance increase.
We can go a step further and calculate the resistive power delivered to the filament as V2/R, where V is the voltage across the bulb (from the variac) and R is the resistance of the filament. For constant resistance, doubling the voltage will result in an increase in power by a factor of 4. There is a wrinkle here, however. As the filament heats, its resistance increases. But how exactly it increases is unclear: is it linear, quadratic, exponential, something else? Turns out that is a somewhat complicated story, and we need to go into the details here other than to acknowledge that resistance increases. The plot below is of data taken in a lab at SUNY Cortland using the bulb and variac system shown above. The resistance is not directly measured but is inferred from current and voltage measurements.
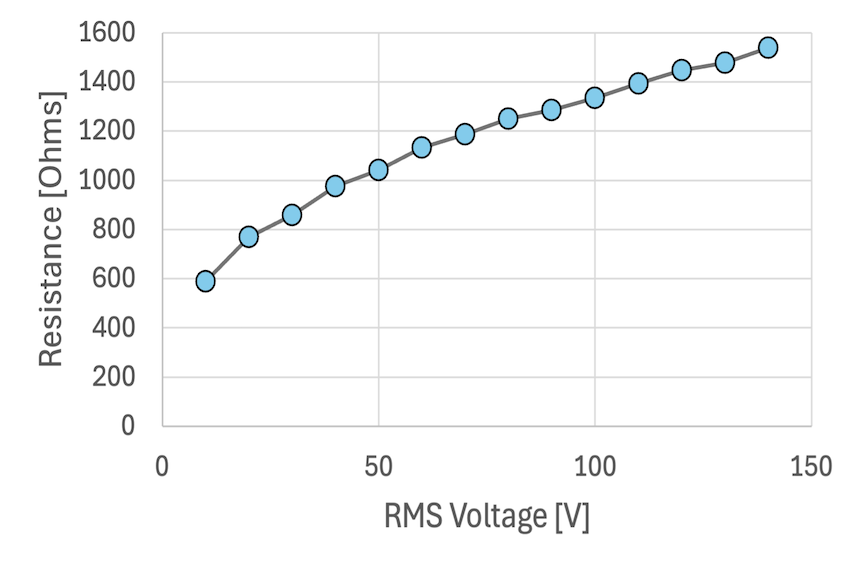
The electrical power dissipated in the resistor can be calculated as the product of the RMS voltage and the RMS current, that is P=IV. Using Ohm's Law (which we can do now that we know how the resistance changes with voltage), we can use I = V/R to get P = V2/R. Because resistance increases with the applied voltage, we expect that the power versus voltage curve will be less than quadratic. The graph below shows exactly this, with the gray line showing the curve we would expect if the resistance were constant (at its lowest value from the graph above), while the blue points show the calculated resistive power using P=IV.

What is the relationship between temperature and the diffraction pattern?
A very reasonable first place to start would be to consider the relationship between the brightness of an object and its temperature, which for an object like the filament of a bulb must be related to the electrical power that flows into it. Clearly, the filament at 100 Volts is quite a bit brighter than the filament at 50 Volts, and that even with the exposure time reduced by a factor of 4.
There is another way in which the pattern of light changes with temperature. As an object gets hotter, the peak of its radiation spectrum shifts to smaller wavelengths. We can see that in the images above where the 50 V case shows only red and green light, whereas the 100 V case shows a full spectrum of visible light with just a faint hint of violet light. This patter of radiation is well known and is called "blackbody" radiation.
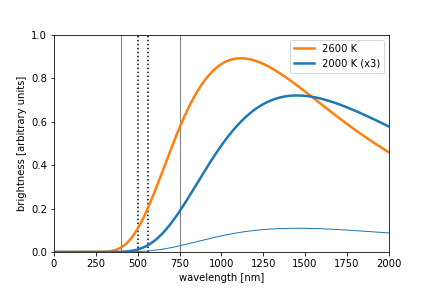
The theoretical blackbody spectra for two objects: one at a temperature of 2000 K (1727 C, 3140 F) and the other at a temperature of 2700 K (2327 C, 4220 F). Note that the plot for the cooler object was increased by a factor of 3 to better compare the shapes of the two curves. The thin blue line lower in the figure shows what this curve would look like if its scale were not increased. The solid vertical lines indicate the limits of the visible range, and the dotted vertical lines span the range of green colors within the visible spectrum as a point of reference.
As a last point, it is interesting that so much of the radiated power occurs at wavelengths larger than the visible spectrum. All of this is infrared light that is invisible to our eye, but which we can feel as radiant heat. Whenever we use an incandescent light bulb, we have to produce this invisible light. For the purposes of creating light to see by, this is terribly inefficient. If we wanted to use a light bulb to also generate heat, this isn't such a bad solution.
How do we compare the electrical and spectral data?
Of course! The key to comparing the electrical and spectral data is recognizing that essentially all of the electrical power dissipated in the filament must leave as radiant energy (the only other pathway would be conductive losses through surrounding material, but that is very small).
Noting that the 100 V picture had very faint traces of violet, we see that this is represented pictorially in the graphs of blackbody radiation shown above by relatively small value of the orange curve near 400 nm. The 50 V case showed signs of green colors, though quite a bit fainter than the reds, and no discernible traces of blue. This is well represented by the blue curve in the graph above since it has small amplitude in the green range and effectively goes to zero for shorter wavelengths. This is all very rudimentary, but from this we could estimate that the temperatures of the filaments are about 2000 K and 2600 K, respectively. These theoretical models for blackbody radiation can also give us a measure of the total radiant power, which is about 2.9 times larger at 2600 K compared to 2000 K.
This number can be compared against the measurements of the electrical power, which show that the power to the filament is about 3.1 times larger at 100 V compared to 50 V. Is this a success or a failure? That is up to you to decide. On the one hand, these two numbers are pretty far off (2.9 compared to 3.1). On the other hand, this is actually pretty good since the spectral analysis was very speculative and we more-or-less just guessed at a few temperatures when making these plots. What this shows is that we got close to the right answer and that there is clearly lots of room for improvement.
Want to learn more?
These and other problems are things we discuss in our curriculum here. You can learn all about the electrical stuff in Introductory Electricity and Magnetism (PHY 202), Intermediate Physics Lab (PHY 357), and Electronics (PHY 440). The discussion of thermodynamics and the connection to blackbody spectrum is covered in our introductory thermodynamics and optics course (PHY 203) and our upper-division theory course on Statistical and Thermal Physics (PHY 430). The phenomenon of wave interference, which is the basis of how a grating works, is first explored our introductory optics and thermodynamics course (PHY 203), revisited with deeper experiments in Intermediate Physics Lab (PHY 357), addressed theoretically in Modern Physics (PHY 410), and fully examined as a quantum phenomenon in Quantum Mechanics (PHY 475).