Bulletin News
11/10/2020
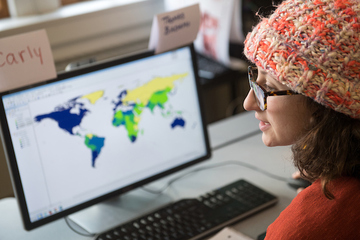
Anyone who’s clicked their way through numerous online interactive maps plotting the many outcome scenarios of the recent U.S. presidential election has come face-to-face with geographic information systems (GIS) technology.
GIS is a framework for gathering, managing, and analyzing data. Rooted in the science of geography, GIS integrates many types of data. It analyzes spatial location and organizes layers of information into visualizations using maps and 3D scenes.
“I have two versions to explain GIS,” said Melinda Shimizu, assistant professor geography at SUNY Cortland, about the 18-year-old baccalaureate degree program.
“One is it’s like Google Maps on steroids,” said Shimizu, who is co-director of the university’s Regional GIS Laboratory, and program manager for the Institute for Geospatial and Drone Technology. “And I had a student who said you could just explain it as ‘Google Maps on Excel (spreadsheet-making software).”
GIS Day is an international day that was originally organized by Esri, a company that makes GIS software, to promote appreciation and understanding of GIS.
On Wednesday, Nov. 18, the Geography Department’s annual open house style event, GIS Day 2020, this year moves from the Old Main Fowler ’52 Grand Entrance Hall to online due to safety precautions due to COVID-19.
Shimizu has created a website to host an array of virtual activities starting on that day, including interactive maps, treasure hunts, videos and articles about what GIS is and how it can be used as a tool to address racial inequity during the COVID-19 pandemic.
Shimizu said the site can be visited anytime starting on that day and no registration or logon password is required.
She provided an overview on the national GIS Day organizers’ planned major theme at its next conference in an era of concerns about COVID-19 and social justice.
This year, sponsors of the national day have focused on how the technology can be used to support social justice.
Shimizu said her own doctoral dissertation advisor provided her with the perfect example of a social justice application for GIS. She had looked at urban heat islands in Phoenix, Ariz., to find that some neighborhoods are actually cooler than others because there is more vegetation in them.
“That’s because they have more water in them, which is because they are more affluent,” Shimizu said. “By comparison, in a poor neighborhood, there was less vegetation, and these areas were demonstrably hotter. It’s the result of the longstanding problems of redlining and segregating of neighborhoods, and our mapping serves to identify the problem, and then to address it. Also, GIS software can be used to create simulations to test different policy options to address the problem.”
Shimizu cites Doug Richardson, a Harvard University scholar, on the subject of social equity: “GIS now plays a key role in helping to understand the interactions of race, ethnicity, and place in our society, and there are many ways in which the GIS community can constructively engage these issues, from community and participatory GIS projects to research programs that examine the role of race and ethnicity in geographic patterns of difference and opportunity around the world.”
Geography students weren’t involved in setting up GIS Day as the have been in past years, due to physical distancing involved in public safety measures taken during the pandemic.
“Students in my GRY 324/Intro to GIS course are practicing learning how to collect data points on their phone and entering them into the system from wherever they happen to be,” Shimizu said. “Some are still in Cortland, some are on Long Island, or Clinton, or Syracuse. These are just points of interest. One student has mapped all the lampposts on a beach and another all the pumpkins in their neighborhood.”
For more information, contact Shimizu at 607-753-2992.